VALIDITY AND INTERPRETATION OF DATA
Tuesday, July 25, 2023
Wednesday, December 14, 2022
MY ICT PRODUCT APA DOC FILE
LEARNING OUTCOMES
You will be able to interpret the outcomes of applying the techniques to the data. So that they answer the research questions that gave rise to them. This interpretation will include analysis of the validity of the answer to the research question in the light of the nature of the data and techniques used.
APA DOC FILE
Establishing
Validity and Interpretation of Data
The
data, collected for research, has to be processed analyzed and interpreted to
develop a solution to the research question.
Validity
Validity
refers to how accurately a method measures what it is intended to measure. If
research has high validity that means it produces results that correspond to
real properties, characteristics, and variations in physical or social world.
High reliability is one indicator that a
measurement is valid. If a method is not reliable, it probably isn’t valid
Types
of Validity
The
followings are the types of validity
1.
Content Validity
A
qualitative type of validity where the domain of the concept is made clear and
the analyst judge whether the measures fully represent the domain (Bollen,
1989, p.185)
The
empirical indicators should be proven to be logically and theoretically related
to the construct
2. Face
validity
Subjective judgment on a construct operationalization
(eg; choosing to measure an employee work efficiency based on punctuality only)
3. Concurrent
Validity
The ability of a test to predict time event/outcome;
the measure and the criterion co-exist at the same time.
4. Predictive
Validity
Ability of a test to measure a future time
event/outcome (eg; student GMAT score and MBA program GPA/completion)
5. Construct
Validity
The empirical assessment of the degree to which
empirical indicators adequately measure the construct
Interpretation
of Data
Data
interpretation refers to the process of using diverse analytical methods to
review dat and arrive at relevant conclusion.
Meaning
of data interpretation
·
Establish inter connection between and
among data
·
Check for indicators whether hypothesis
are supported or not by findings
·
Link the present findings with the
previous literature
Following
are the Interpretation of data given below
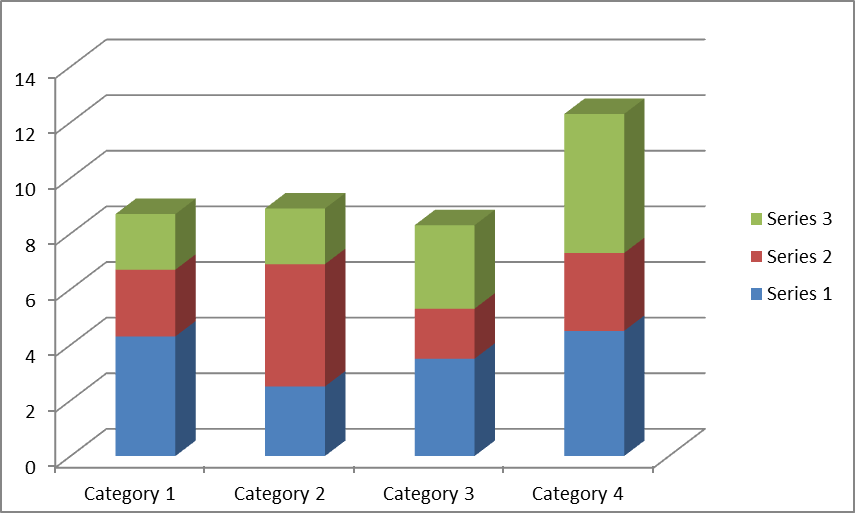
Figures 1
Graphs
Figures
3
Charts
Figures
4
Table
|
Sl no |
|
Class divisions |
|
Total Students Number of girls number of boys number |
|
1 |
|
10A |
|
40
12
28 |
|
|
|
|
|
|
|
2 |
|
10B |
|
32
10 12 |
Method of data interpretation
·
Direct
visual observations of raw data
·
After organizing the data in
tables
·
After
making Graphical representations
·
After
using numerical/statistical methods
·
After
mathematical modeling
Sunday, December 11, 2022
Saturday, December 10, 2022
-
CLICK HERE
-
LEARNING OUTCOMES You will be able to interpret the outcomes of applying the techniques to the data. So that they answer the research questi...


.png)


